


Making the right decisions and outperforming the competition requires having round-the-clock access to crucial business reports with intelligent filtering and comparing mechanisms tailored to your needs. MetricsCube fills the gap with custom sets of powerful reports built specially for WHMCS.
In contrast to other solutions available on the market, MetricsCube offers dozens of extremely accurate, in-depth reports that will let you understand all processes taking place in your company. Basing on dedicated, completely secure data fetching methods, our tool will show you the best way to optimize your decision-making process and manage your WHMCS-based business like a pro! MetricsCube will help you get the full picture of your web hosting company and boost your strategy to succeed at all levels.
Amazing WHMCS Reports
The business insights you are looking for are now within reach. MetricsCube offers seamless integration with instant access to complete sets of custom reports designed exclusively for WHMCS.
Premium
Premium
Billing
Subscriptions
Retention
Churn
Renewals
Services
Domains
Customers
Support
Other
Enjoy an extended choice of advanced graphs and reports that will give you a much more thorough look into the numbers behind each stream of your Monthly Recurring Revenue.
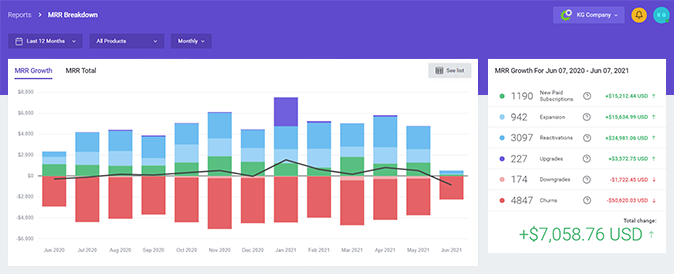
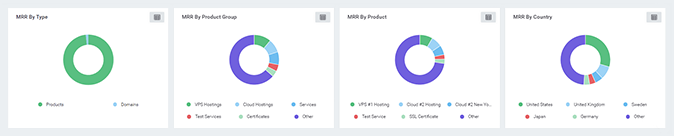
Develop more effective budget forecasting by analyzing your monthly income from every angle possible, including that of its type, product, product group, as well as the country.
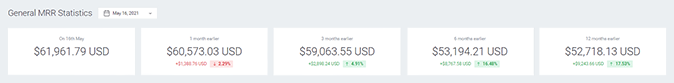
Contrast any chosen stage of your business performance with the revenue results that precede it to find clear correlations and draw actionable conclusions.
Covered sections of Monthly Recurring Revenue:
Understand crucial areas of your finances to become more confident in making business decisions. This will help you enjoy excellent financial health, achieve all your budget goals and therefore gain optimal growth results.
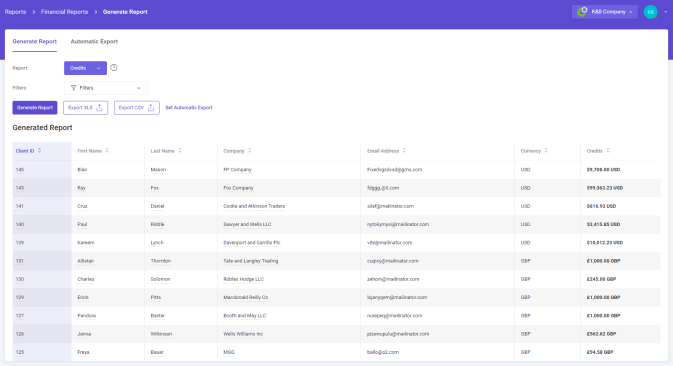
Whether you need to view the details of individual transactions or credits that your customers have, you will never again have to guess how much money flowed into your system in some certain period of time.
Think of your revenue as a giant puzzle, with each piece having a different shape and therefore needing to be looked at carefully from all angles. Fortunately, now you can do all that analysis via just a single section.
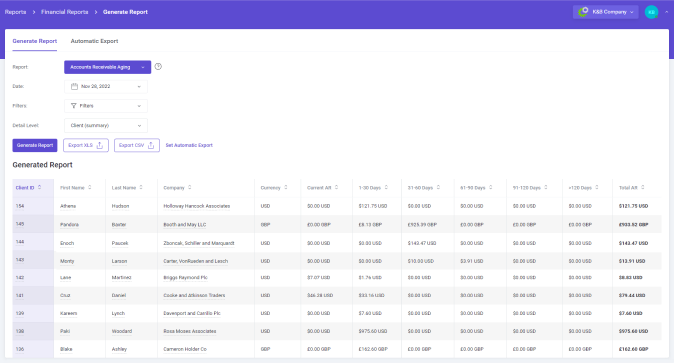
Unpaid orders provide at least as important an insight into the reliability of your clients as paid ones, which is why this section details every order that has yet to be completed, with access to specific amounts per customer and times how long they remain outstanding.
Specific financial areas in focus:
Bring together essential metrics that reflect your business health across services, customers, and revenue. Having them all unified in one clean place makes it easy to spot trends, compare periods, and keep track of the bigger picture without losing the details.
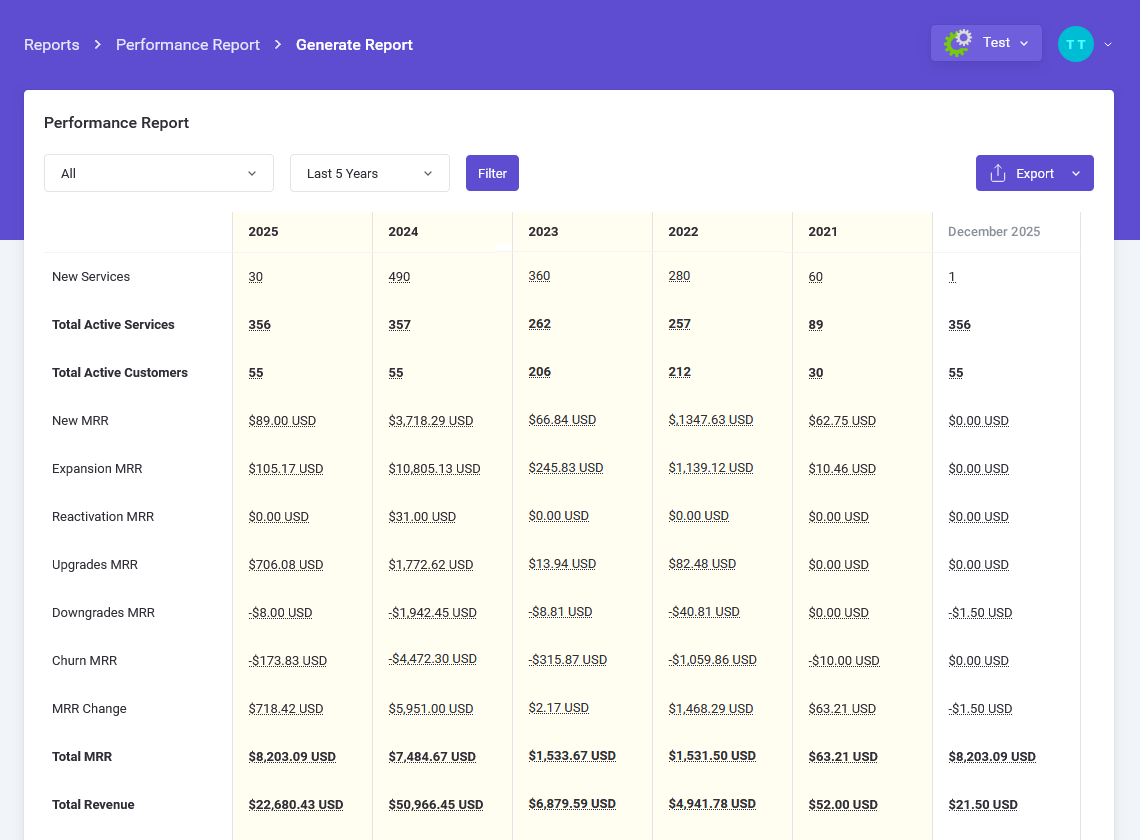
Performance is as much about where you are now as it is about how you got there. With monthly insights and multi-year comparisons side by side, you gain a sense of continuity and see how decisions made months ago translate into changes in revenue or churn.
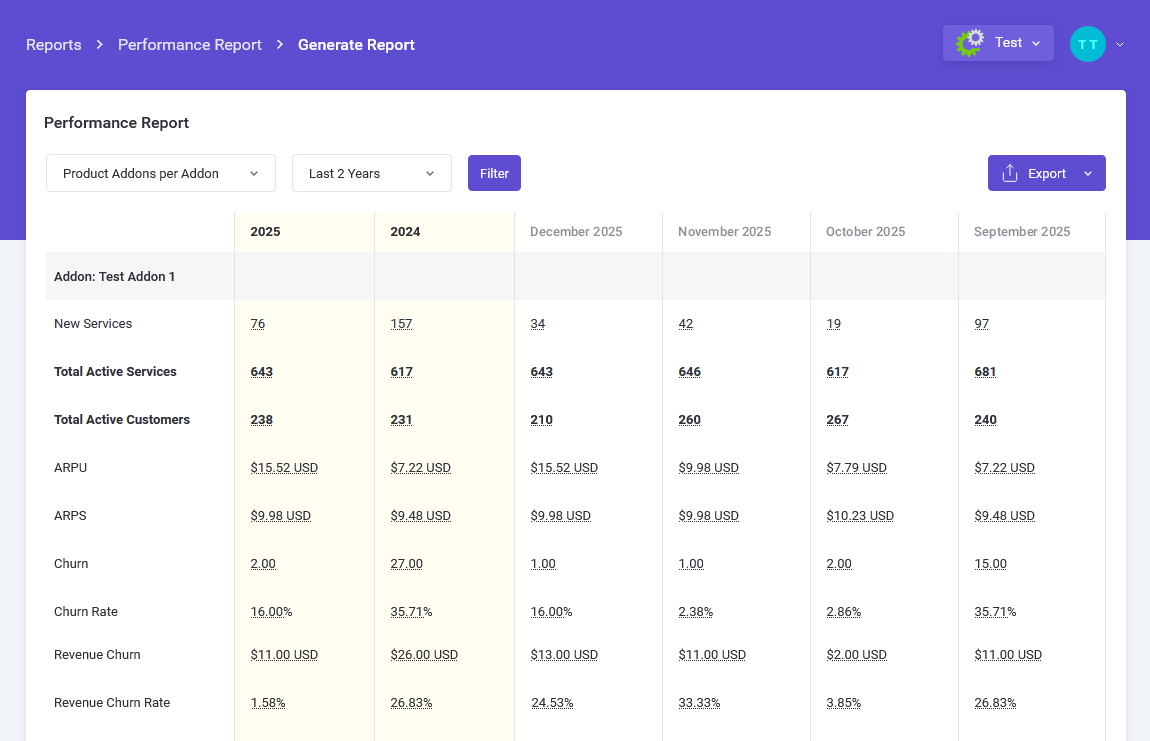
To make working with so much data effortless, the report is arranged into six clear sections. Each of them offers a different perspective on your results, whether you want a full overview or prefer to dive into products, groups, domains, or addons.
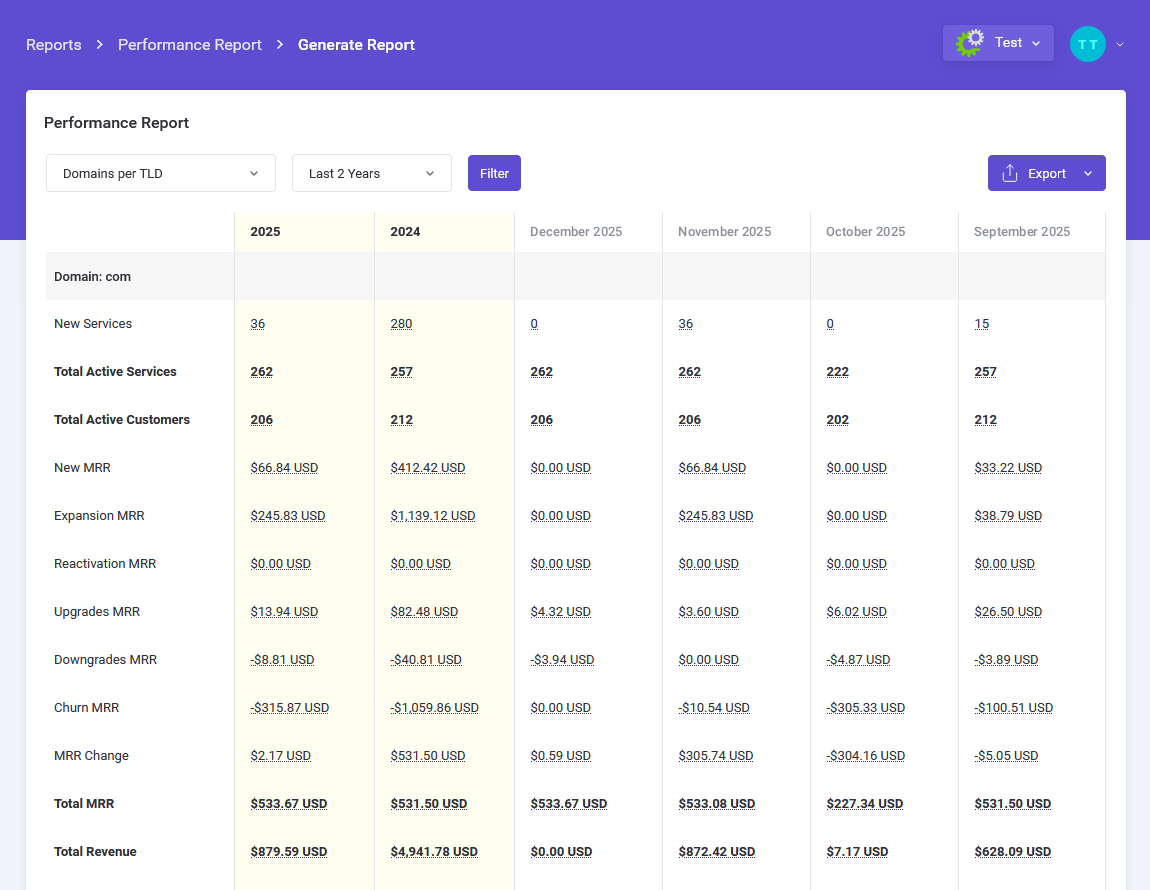
Insights matter most when they lead somewhere, which is exactly why the report is fully interactive. Every value you click takes you straight to a relevant place inside MetricsCube, already pre-filtered to show the exact context behind the number.
Core performance aspects explored:
Monthly Recurring Revenue (MRR)
A total interpretation of the Monthly Recurring Revenue and its changes. Select dates to compare, use predefined comparisons to direct your company to its fullest growth.
Annual Recurring Revenue (ARR)
A total and thorough analysis of recurring revenue and its changes with a yearly scope of evaluated data. A notable extension to the great MRR reports.
Customer Lifetime Value (LTV)
Curious about which of your customers are most valuable to your business across time? Check out their lifetime performance with exact values and percentage visualisations.
Paying Customer Lifetime Value (PLTV)
Stretch your thinking about the customer journey! This report will show you how much money a client is expected to spend at your site throughout their entire time as your paying customer.
Average Revenue Per User (ARPU)
Report that evaluates the estimated revenue from each active customer per service. General comparison and detailed calculations with exact amounts and percentage differences.
Average Revenue Per Paying User (ARPPU)
Understand how much you are earning on average from a single paying customer by eliminating the free or non-revenue users from the math.
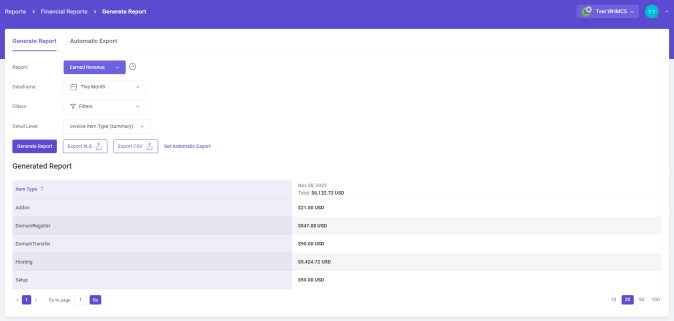
Revenue
Do not waste time on mundane and time-consuming searches. Here it is! The value of transactions with all the special cases you may ever think of.
Net Revenue
Report with more than just general transactional revenue. In case you need quick calculation, open and check the net value not to get a false impression.
Accrual Revenue
Probably the most extended report with a full board of filtering options from a product group to TLDs. Revenue in value and percentage - all that in a clear and user-friendly form.
Accrual Net Revenue
In this section you can analyze gathered data on your company’s revenue net of discounts, returns etc. Check out the overall trend or pore over the accurate tables.
Active Subscriptions
A great insight into your store that provides a number of data on subscriptions that have not ended for a selected period of time with option to shift the time periods.
Active Subscribers
This report is designed to let you follow the rate of your clients who decide to keep on active subscriptions. Find the most active areas and groups of your clients.
New Subscriptions
Active Subscriptions report seems not enough? Enhance your marketing plan by considering the newly subscribed products only.
Expansion Subscriptions
A totally new perspective to allow comparing active paid subscriptions with the newly ordered ones. Take a look and evaluate.
New Subscribers
New subscribers among the new clients. Check the numbers and find out how many of them deserve a discount!
Retention
Are you ready to stand face to face with the true numbers? Open up the retention reports and check if you are the one who keeps the clients and knows how to maintain the relations for long. Hence, trace any kind of recurring service or addon that has ever been purchased and the clients tendency to renew them again. Observe the retention rate of domains as well as any recurring addon or service, with a clear division on the new and the active ones, to verify your maintenance abilities and finally get the real and true audit of your business in any time needed. Retention reports available in either traditional table or their graphical representation on a chart:
Revenue Churn
Perhaps the most wanted information for each and every one of businesses. Just open to see whether the predicted income does not fall below expectations to react quickly enough.
Revenue Churn Rate
Ratio of the total value of lost revenue in the last 30 days of the current MRR. View the latest graphs, compare, change and filter to get what you want exactly.
Subscription Churn
If you have noticed a sudden drop in any of your subscriptions, open this report and you will get a clear overview to check whether the tendency shall be already worrying.
Subscription Churn Rate
Need more precise data? Instant summaries of churn rate per product, product group, addon and TLD as well as general rate graph with an extended filtering tool.
Customer Churn
A full summary of customers activity. Check the time periods of the highest stagnations, compare with other periods and act without wasting time on further assumptions.
Customer Churn Rate
Measured on a monthly, quarterly or annual basis. Define time period for your actual churn rate to get insight into data that will help you foster your customer relationships.
Revenue Renewal
Report that will show your daily revenue earned from renewed services, addons and domains by all of your customers.
Revenue Renewal Rate
Monitor the ratio of earned revenue and the tendency that might fall or rise to correctly predict the approaching measures.
Subscription Renewal
No place for cheating, only true facts and pure numbers to see how many has renewed the subscription and how many has not.
Subscription Renewal Rate
If you need long lasting analysis, check the renewal statistics of subscriptions per whole month of your choice.
Customer Renewal
Want to find out how prosperous was today? Nothing easier, come in and check how many of your dear customers decided to renew their services and how many changed their mind.
Customer Renewal Rate
Worried about customers’ falling renewal tendency? Follow the trends, draw conclusions and, which is the clue here, react adequately!
Services Revenue
Most popular report with the most advanced comparison and filtering system to give you not only numbers but also instant answers to your queries.
Average Revenue Per Service
General services income is not enough? Check out this report and get deeper analysis with differences calculated per product and product group.
New Services
Clear visualisation representing the ups and falls of new services in your system. Perfect way to grasp the trend and get detailed calculations of values and percentage changes.
Services Lifetime
If you seek information on how long an average service is active, then this is the right place. Change dates to customize your results and get the most of it.
Active Services Per Country
A clear map will be a perfect answer if you are looking for the most active region or wondering where stronger marketing actions shall be directed.
Active Services
Monitor the graph that shows you the increase or decrease in the number of active services within required time frames, groups, types and surely single products.
Billing Cycles
Special report to perfectly illustrate the number of services in a specified billing cycle. See the visualisation and a table view as you prefer.
Services With Domain Ratio
Report presenting statistics on the services with and without any active domains assigned. Scan the ratio of the two to see the latest movement.
New Services Income Ratio
Need really quick answers? See a ready made comparison of all the services total income versus new services only within the last month!
Services Lifetime Value
In case you only wish to take a look and check the predictions on a given service, then here you may find any info on the changing value expectancy of any service available.
Domains Revenue
Report that will show you precise data on all the revenue from paid invoices only. See how your income grows day by day and which TLDs are the most profitable.
Average Revenue Per Domain
Wondering how much revenue may you expect from a single domain? Check ready calculations and gather needed data to predict your budget.
Registered Domains
Revise how many domains you have registered per day, compare data with other time ranges, and even look into details on every TLD in your offer.
Transferred Domains
Need to compare how many domains have been transferred within the last month? Do you need such comparison every month? No more mundane calculations as everything is here!
Domains Lifetime
Report presenting an average number of days that a domain remains as active. Select periods and filter results to get data you need.
Active Domains
Keep an eye on the still changing graph with the number of active domains, follow the up and down periods to catch the heavy moments.
Active Domains Per Country
Need a quick preview of active domains location across countries? Open the map, hover over the country to get summaries or see average in the bottom table.
Domains With Service Ratio
Report that will give you a quick and fair answer when you need to check the balance between domains with and without any active services related.
New Domains Income Ratio
Your income from new domains set against the domains total income - hope the conclusions are positive!
Domains Lifetime Value
Perhaps you are curious in predictable profits that you might gain from every single domain you offer? Nothing simpler, just step by and find any calculations you may think of.
New Customers
Follow the line representing the increasing or decreasing number of new clients, stop to get a ready-made deep analysis of the situation not to waste your time on additional searches.
Total Customers
A total number of clients in selected time ranges – current status, client group and country of origin – all that with daily synchronization of data to assure thoroughness.
Active Customers
Seek for the most essential and current data analysis of the changing line representing the number of clients with at least one active service? Here you will find it
Active Customers Per Country
Country analysis that highlights distribution of active clients across the world illustrated on a user-friendly map with summaries shown on hover.
Tickets By Priority
Keep account of any created ticket in your system and inspect their importance basing on their priority and number of queries to your support. See percentage growth or fall.
Tickets By Product
Monitor which of your offered products require the most attention. Audit the statistics on groups, types and single products to draw adequate conclusions.
Average Customer Response Time Per Product
High rush in your support team? See which products require more attention and increase the workload in your team.
Closed Tickets Per Admin
Open this report to run through the average number of closed tickets per admin within any time range that you need. Compare, analyze and draw the conclusions on the run.
Average Response Time Per Admin
Report that will help you reexamine your admins productivity basing on their response time – contrast your best people and motivate to win the race!
Average 1st Response Time Per Admin
Follow your admins productivity and work speed! Check who is the true leader and confront the results before granting the bonus.
New Orders
Noticed a fall in the number of new orders – check whether it is a long-term trend or just a temporary incident. Use the graph to predict the tendency and keep the line going up.
Cancellation Requests
Some of your products seem to be of less interest recently? End of billing period or perhaps there are more immediate cancellation – inspect and act immediately.
Tax Value
Want to control how much you spend on taxes over a year or a week? Check the timeline graph, run over the comparisons per product or a client country.
Late Fee Income
Would you guess the income you earn purely from the late fees? This raport will show you exactly how much money is collected from the penalty charges applied to overdue invoices.
Unpaid Invoices Value
Not only purely summed up values as you might expect, but advanced tool to count, measure, compare and get instant answers.