







The more products a web hosting company offers, the less useful total revenue becomes as a standalone measure. It shows whether the business is growing, but it does not explain specifically which services are driving that growth, which ones are losing ground, or how individual products perform once renewals, churn, upgrades and customer activity are taken into account.
The latest MetricsCube release addresses that gap with a new Premium report dedicated entirely to product performance. Product Analysis brings the most important product-oriented metrics into one place, making it easier to compare services, follow changes over time and understand what each part of the collection is contributing to the business. The release also introduces Revenue per Billing Cycle, a new addition to Billing reports that shows how revenue is distributed across different billing periods.
Together, the two reports give web hosting companies a clearer view of what customers are buying, how those products perform after the initial order and how billing preferences influence recurring revenue.
In a hurry? Here’s the TL;DR
- Product Analysis – a new Premium report focused on product performance, customer activity and recurring revenue trends.
- Revenue per Billing Cycle – a new Billing report showing how revenue is distributed across different billing periods.
- Key benefits – better visibility into product performance, customer behavior and recurring revenue composition.
Product Analysis
The new Product Analysis report provides a detailed view of individual products and product groups without requiring you to piece the answer together across several different sections of MetricsCube. Revenue, active services, orders, churn, receivables and support activity can now be examined within the same report, so changes in one metric can be considered alongside everything else happening around the product.
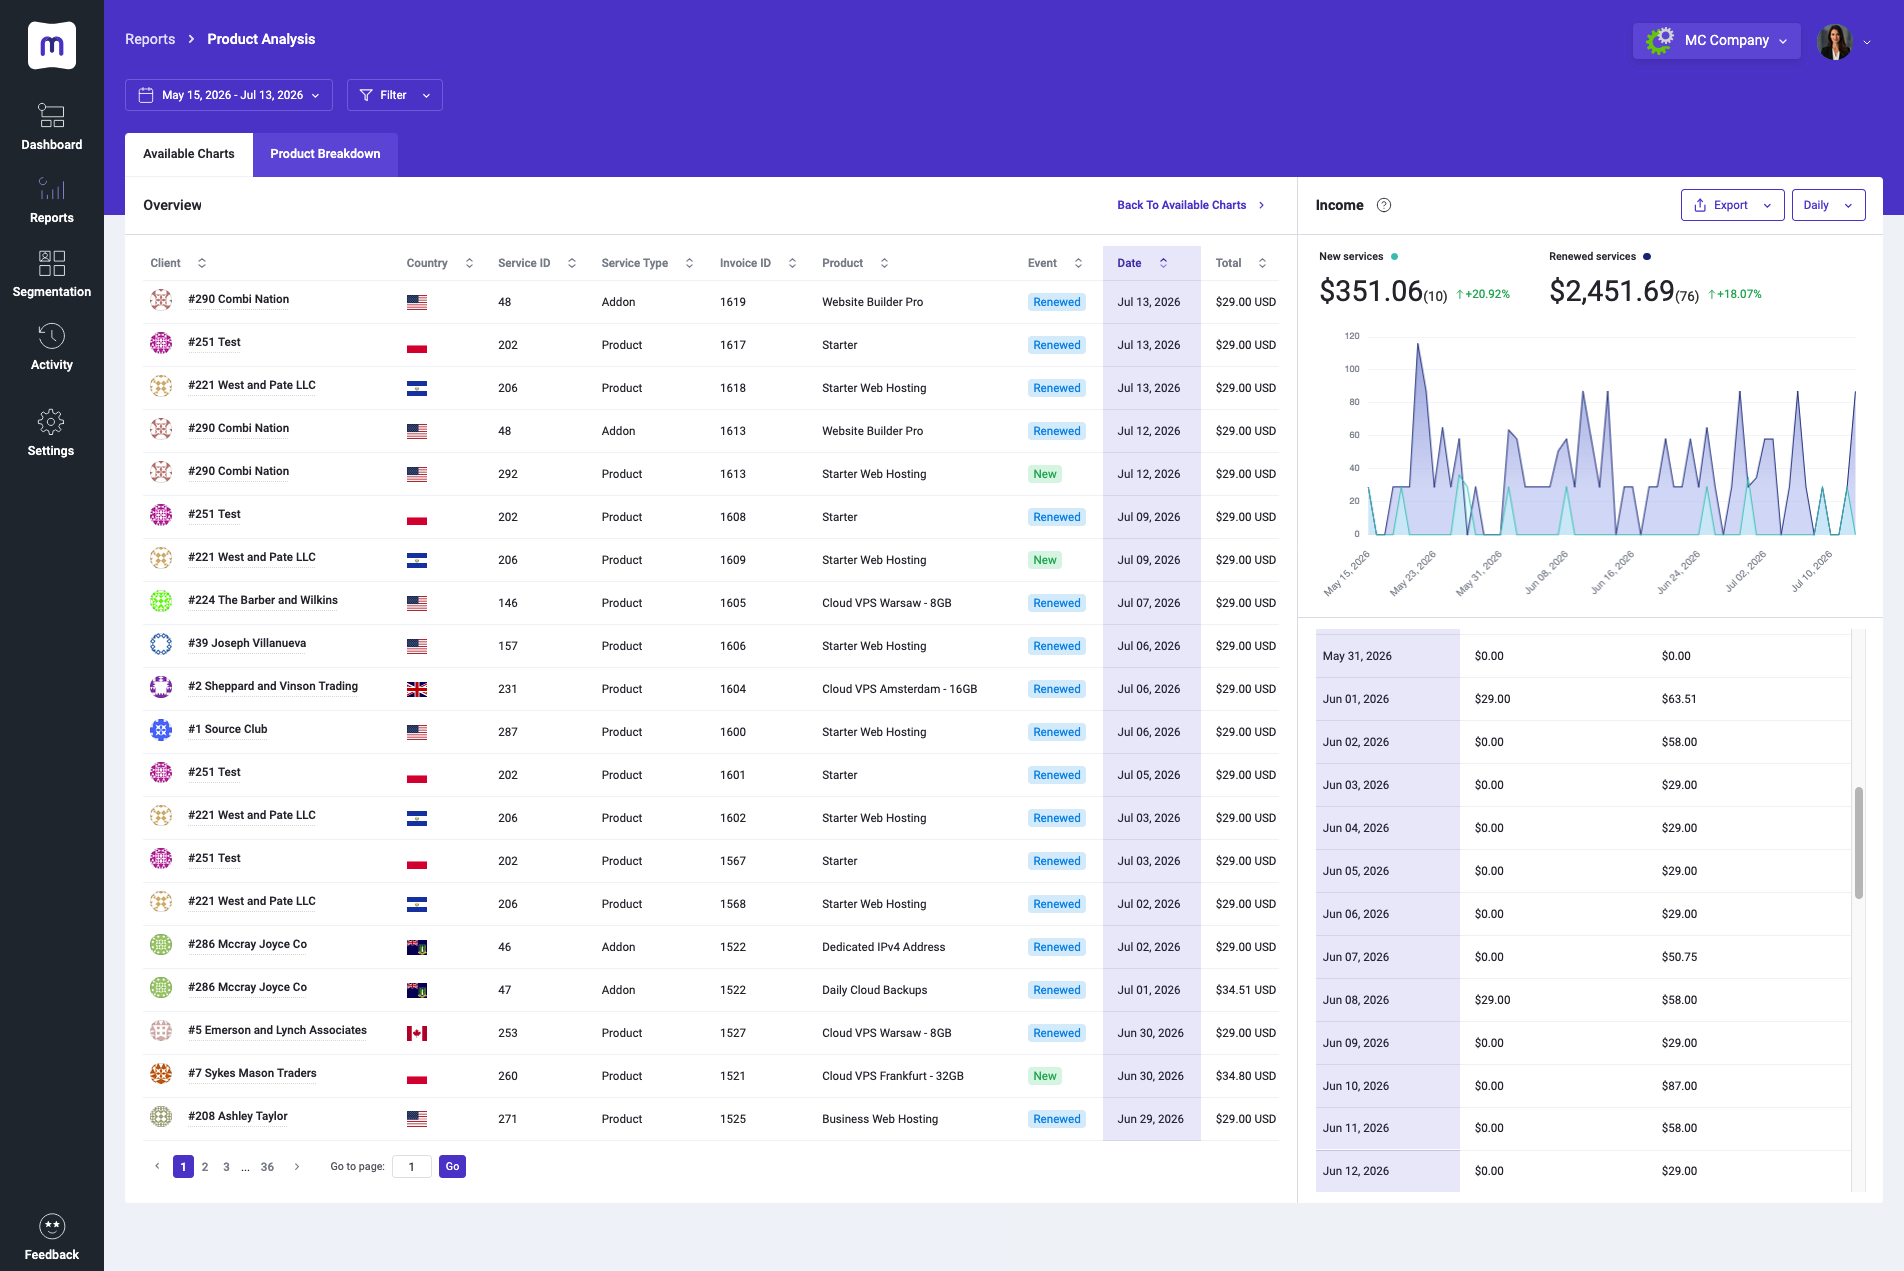
This makes comparisons far more useful than a simple revenue ranking. A product behind strong sales may also be losing customers at a rate that deserves attention, while another with a smaller share of current revenue may be growing steadily and retaining clients far more effectively. Product Analysis makes those differences visible and gives you enough context to understand whether a result comes from new sales, renewals, account changes or the existing customer base.
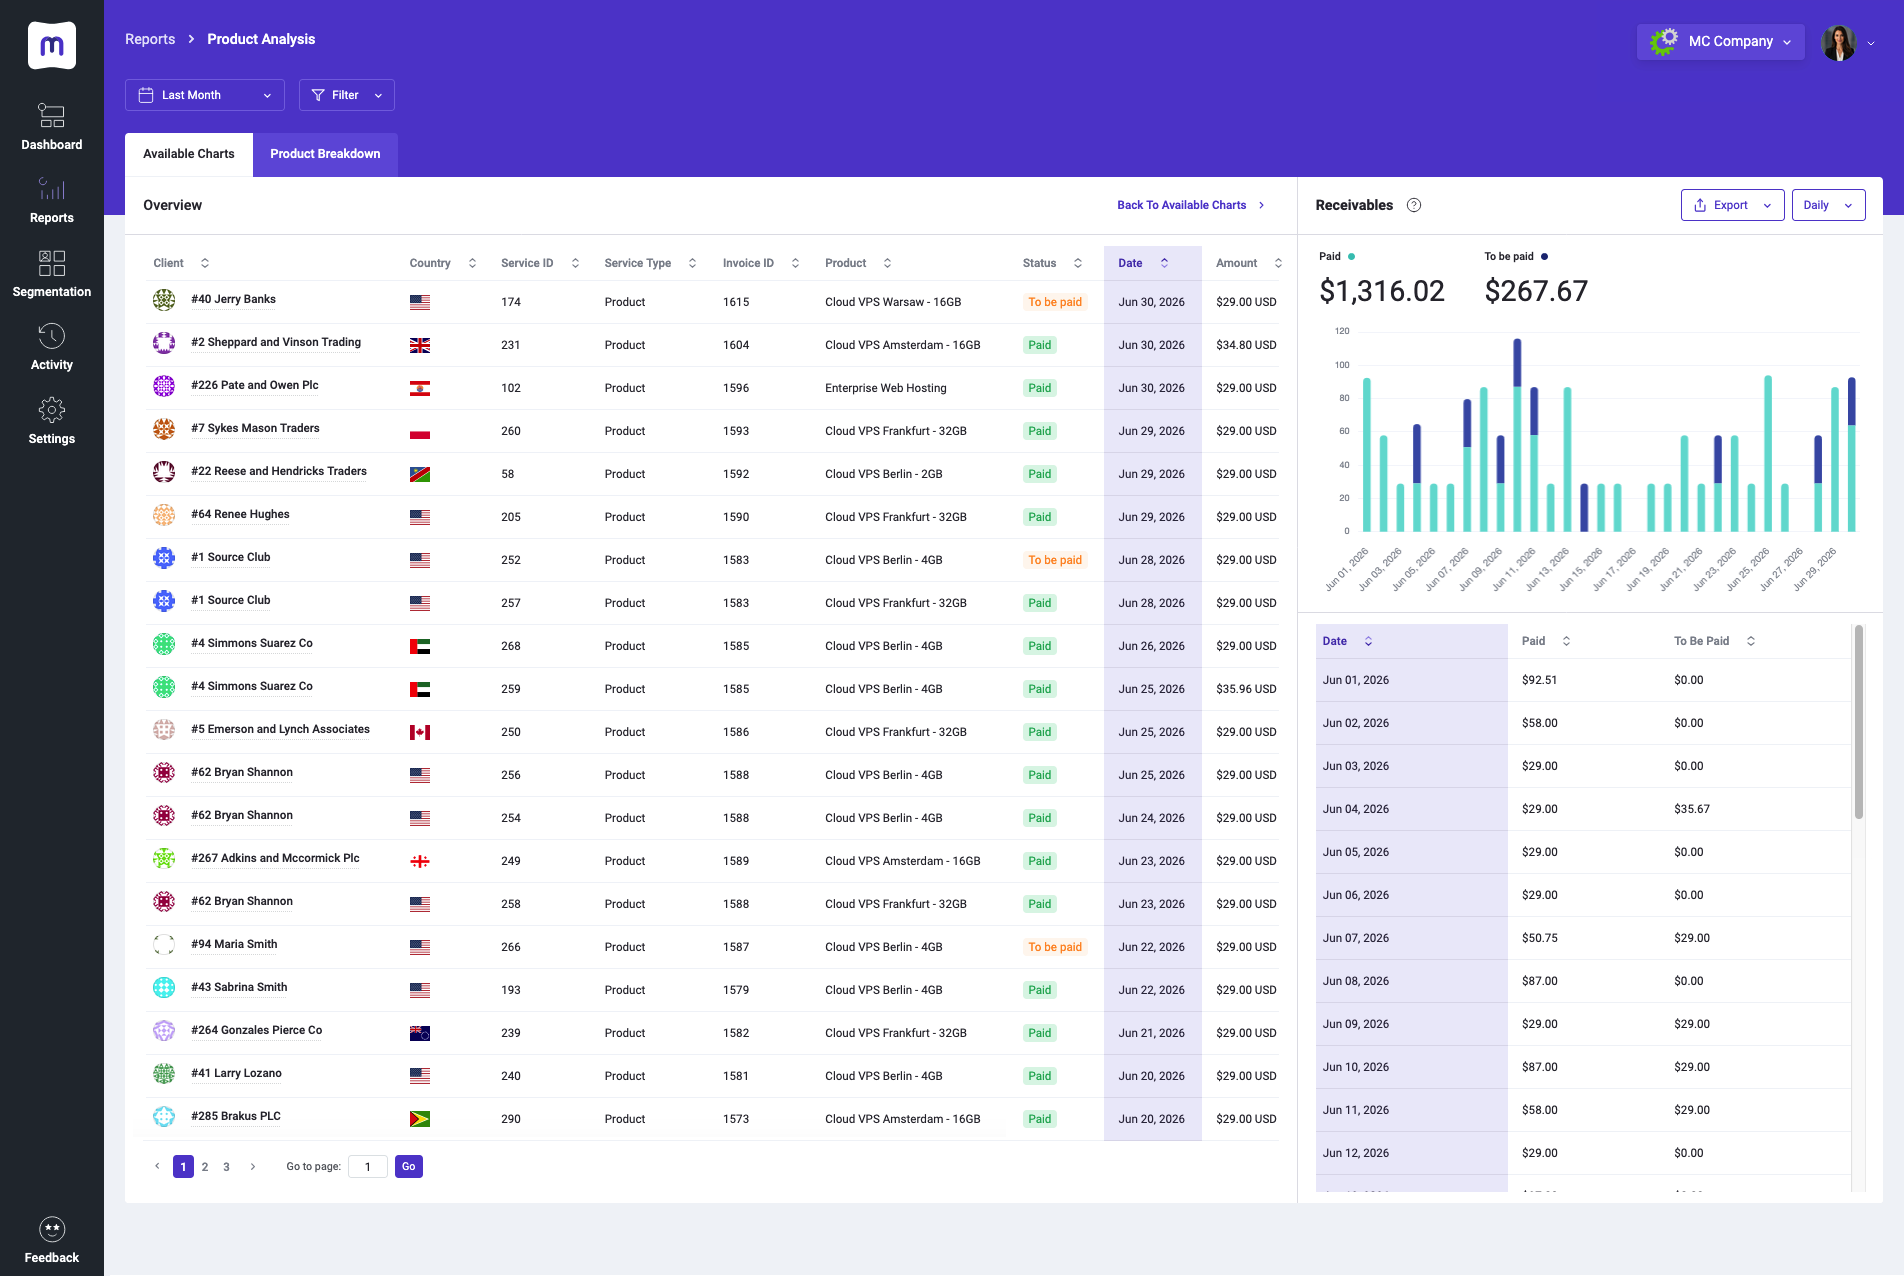
The report can be used to compare products over selected periods, examine trends and identify services that behave differently from the rest of the offerings. It is particularly useful when reviewing pricing, deciding which products deserve further development, checking the impact of recent changes or preparing a broader assessment of the offer.
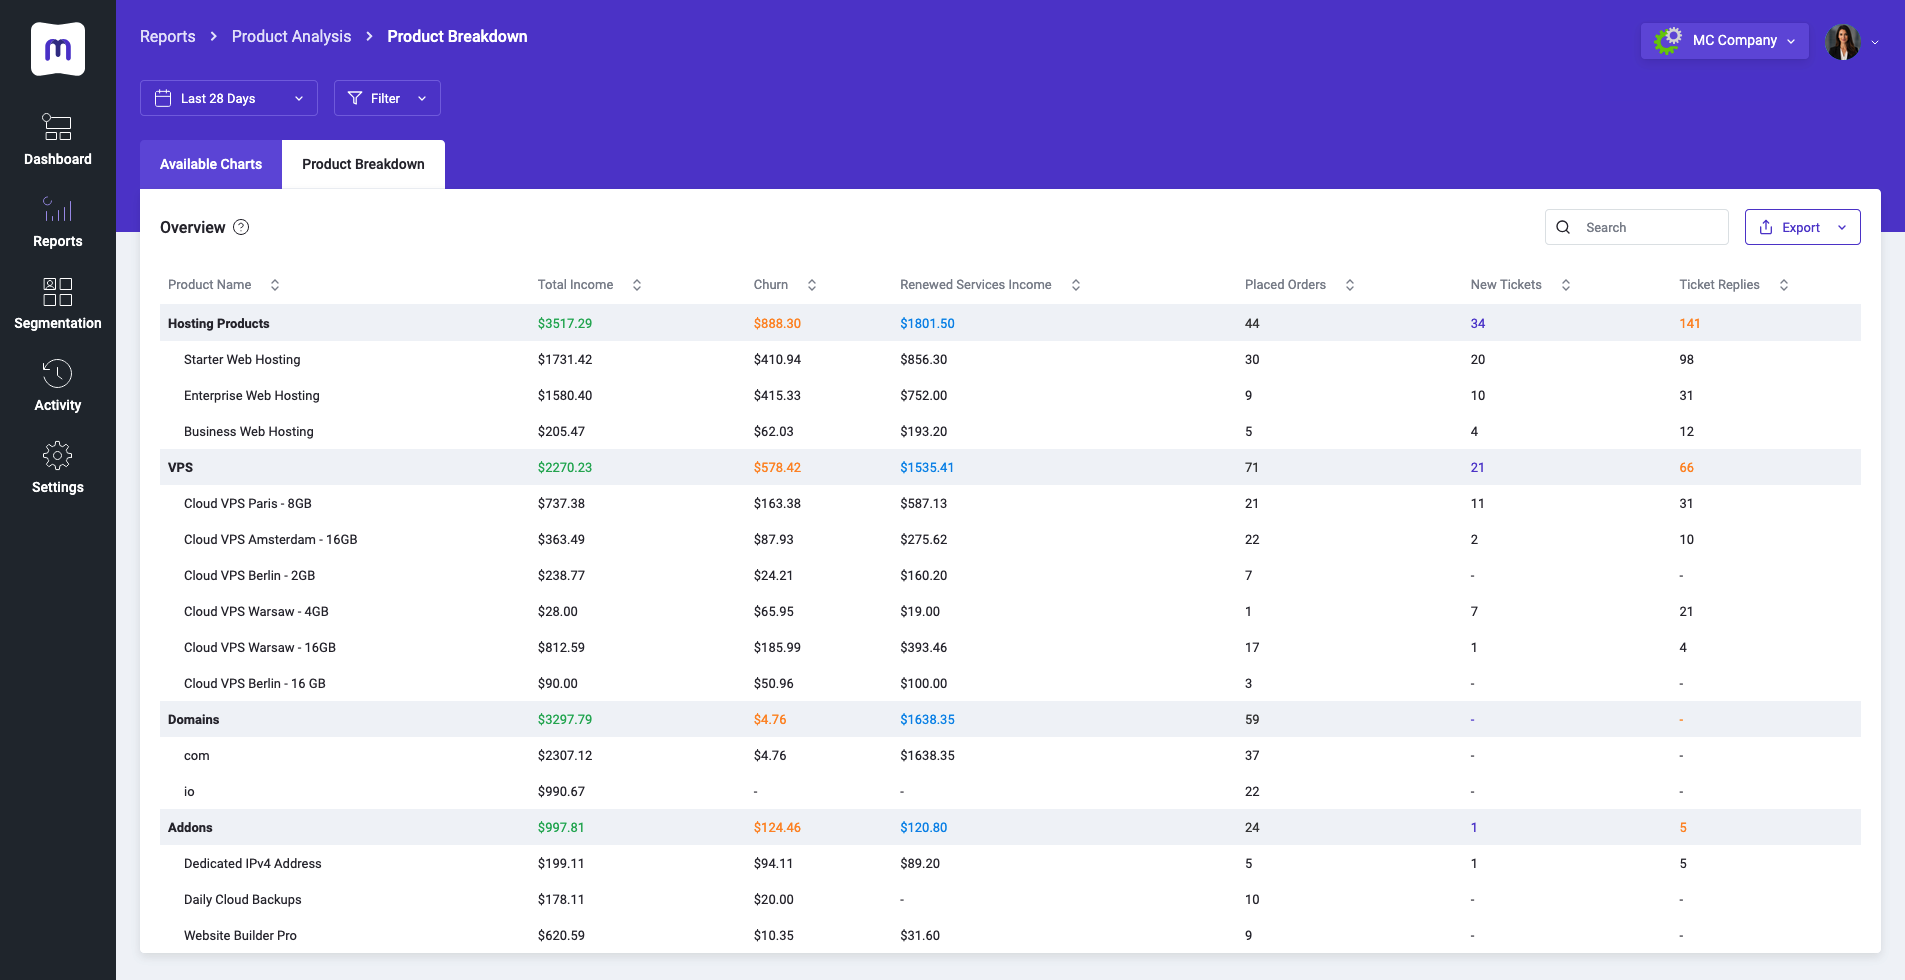
Rather than treating every service as another line in WHMCS, Product Analysis shows how each one performs as part of the business. That distinction matters once the product range becomes too large for assumptions and general revenue figures to remain reliable.
Included in MetricsCube Premium
Product Analysis joins Performance Report, Financial Reports and MRR Breakdown in the Premium category. Full access to these reports is available with the Pro pricing model and every higher plan.
Revenue per Billing Cycle
The second addition in this release is Revenue per Billing Cycle, now available in the Billing section. The report shows how revenue is divided between the billing periods used by customers, including monthly, quarterly, semi-annual, annual and other cycles configured in WHMCS.
This makes it possible to see not only how much revenue was generated, but also exactly what payment structure produced it. Two periods may end with similar totals while relying on very different billing patterns. One may be supported mostly by annual renewals, while another depends much more heavily on monthly payments. The final figure may look nearly identical, but its composition says much more about customer preferences and the timing of future revenue.
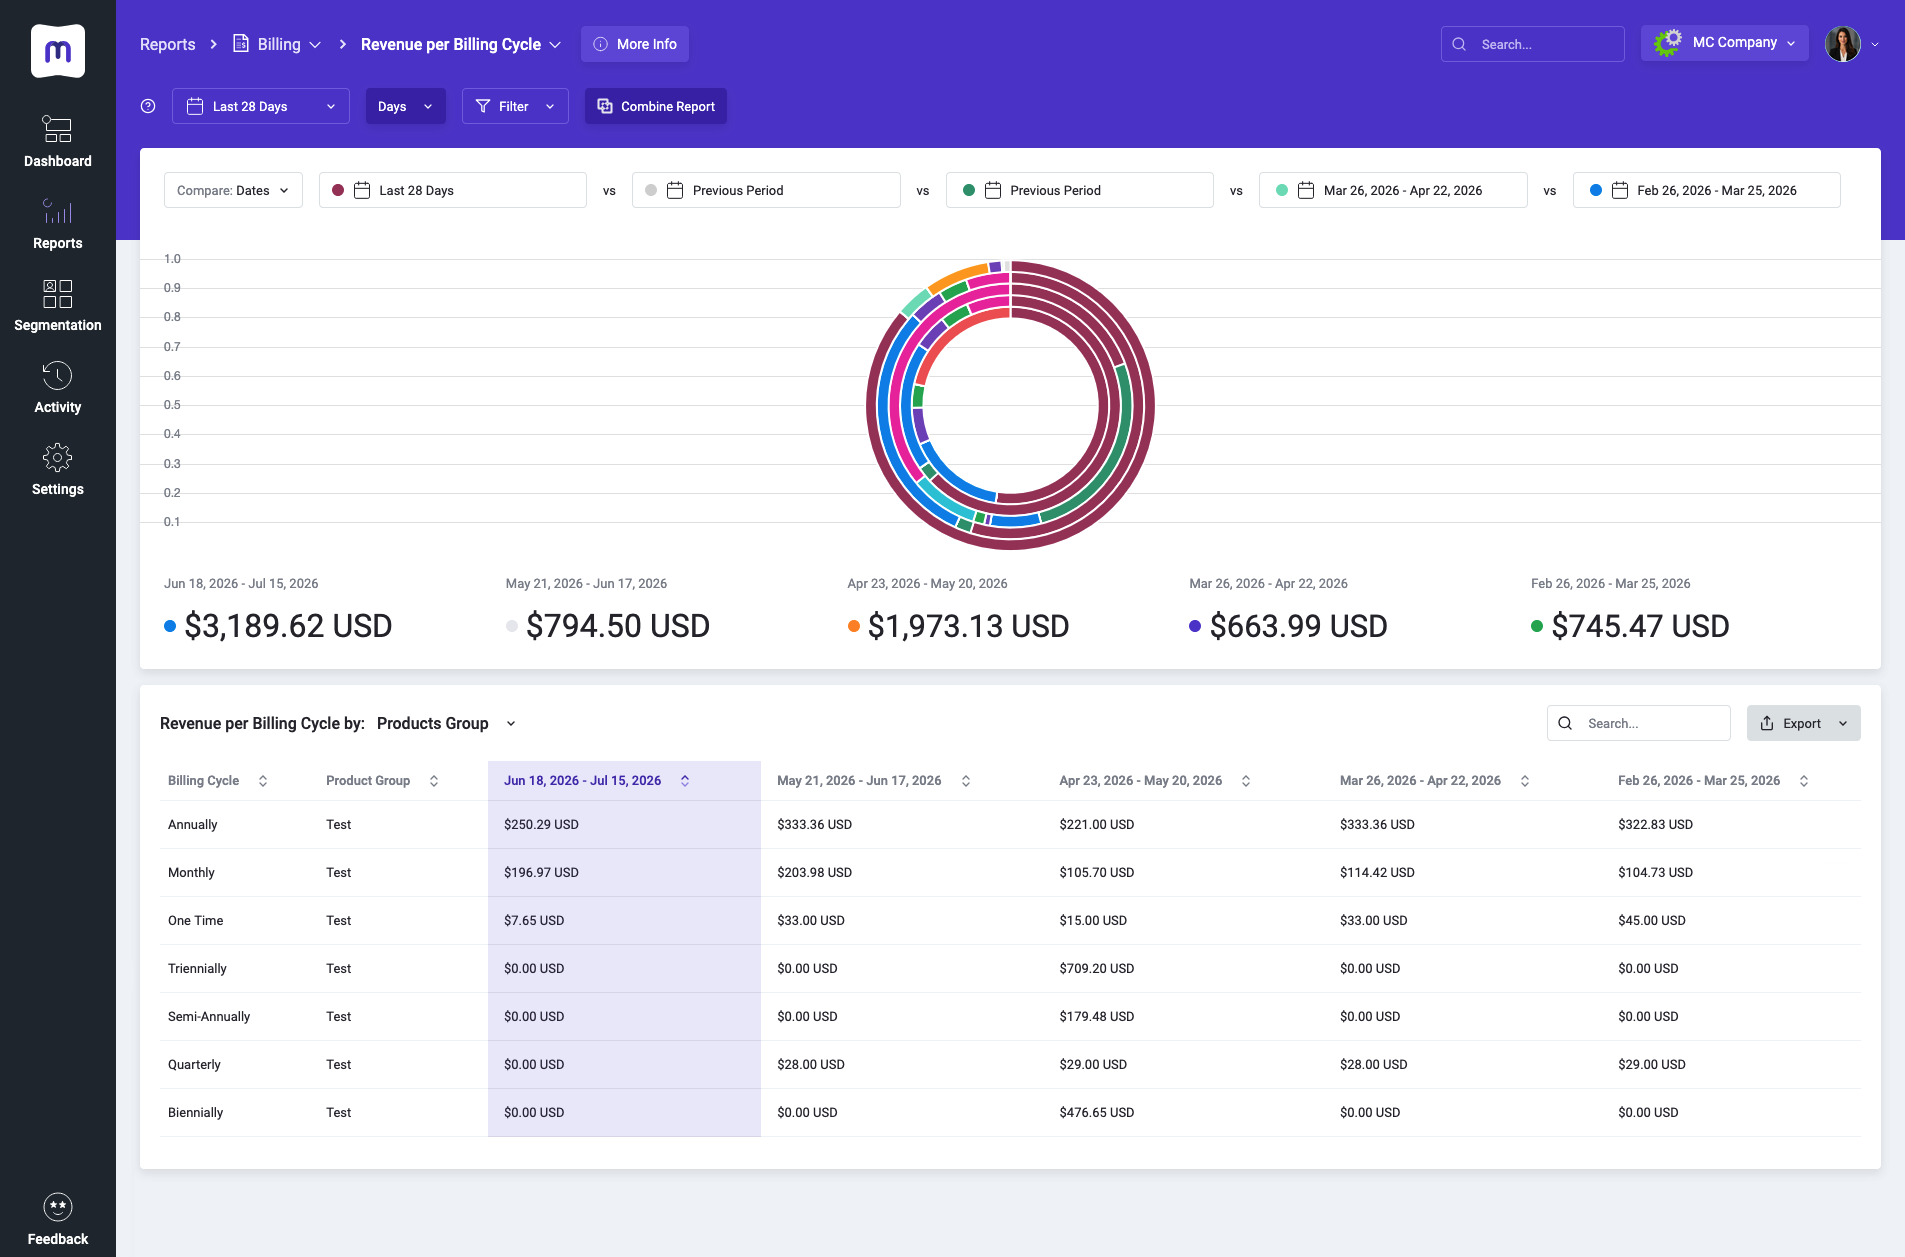
Revenue per Billing Cycle also makes changes in those preferences easier to follow. You can check whether customers are moving toward longer commitments, whether a pricing adjustment affected the way plans are purchased or whether a promotion brought in a different mix of billing cycles than usual. The report is compact, but the question it answers appears frequently in revenue planning and pricing discussions.
Better product decisions begin with better comparisons
A web hosting company rarely needs more data for the sake of having more data. What it needs is a reliable way to compare products without losing the context that explains why the numbers look the way they do.
Product Analysis provides that context at product level, while Revenue per Billing Cycle adds a clearer view of how recurring revenue is structured. Neither report replaces business judgement, nor is it supposed to. Their value lies in making sure that judgement is based on what products are actually doing rather than on which ones happen to receive the most attention.
As hosting offers continue to expand, that becomes increasingly important. MetricsCube gives companies a practical way to keep the entire product range under review, notice changes early and make decisions while the information is still useful.
